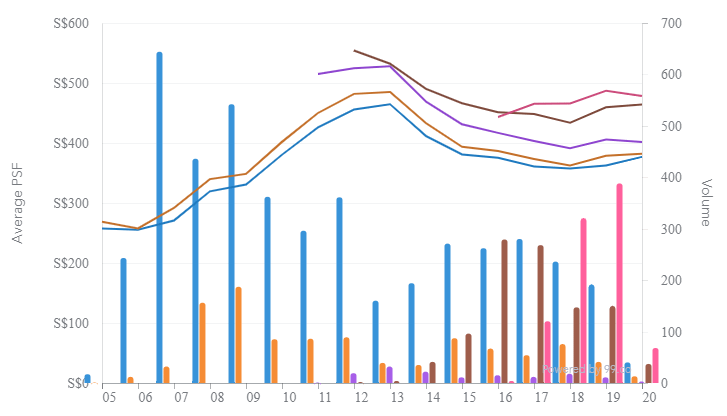
Punggol HDB Resale Transactions (4 And 5 Room Flats)


Source: URA, Realis, and 99.co. For 4 and 5 room units in Punggol.
From the above graph we can infer the following:
1) Strong up trend in price per square foot till 2012/2013 period
2) Peak prices between 2012/2013
3) Each new batch of units which reached MOP generally sold at a higher per square foot than their predecessors
4) Price per square foot difference between TOP periods tends to narrow over time
5) Price has been relatively flat from 2016/2017
Why Did Prices Peak in 2012/2013?
In early 2013, the government introduced Mortgage Servicing Ratio which caps the amount that may be spent on mortgage repayments to 30% of a borrower’s gross monthly income. This effectively reduced the amount of loan they can take from a bank. In August the same year, the MSR cap for HDB-issued loans was also reduced to 30% from 25% to bring it in line with the banks. With loan amounts limited, buyers had to scale back on their budget or consider purchasing a private property where MSR limits do not apply when qualifying for a bank loan. This in turn placed a hard cap on how much potential home owners could pay for a house and reduced demand in the purchase of resale HDBs causing per square foot price to drop.

Possible Price Trends Going Forward
Firstly, looking at units which TOP on or before 2010 seems to be relatively stable in price over the last 3 years with comparatively lesser number of transactions. This trend is expected to continue as there are no market moving factors expected.
Secondly, for units which TOP between 2011 to 2013, there has been a more significant price appreciation since the low of 2018 however, based on past trends, it is unlikely for the increase to continue as newer flats generally command a higher per square foot price as compared older units. In addition, in 2019 there was a 33.4% increase in the number of HDB flats which were 10 years or younger which was sold2, as this batch of units gets older, demand might be impacted.
Lastly, for units which TOP between 2014-2016 seems to be on a slight upward trend, however, it would first need to breakout of the shorter term downward trend. With over 80,000 units reaching MOP between 2020 to 2022 and a large portion located in Punggol, we are concerned that buyers would favor newer units as they have a longer lease period and would generally be better maintained.
10 Years Later
To put the above into numbers and assume that price trends would likely remain stable as they have since 2013, if an owner is sitting on $200,000 profit, what would it be after 10 years?
Assuming a purchase price of $370,000 and 90% loan from HDB, and an interest rate of 2.5% for both CPF and HDB loan, and the unit was bought in 2013, total interest paid in 10 years time (excluding capital repayment) to both HDB and owed to CPF would be more than $176,000.
(purchase price × 90%) × (1.025)^17 – original loan amount
HDB Resale Price Index (Whole of Singapore)

If current HDB trends continue, your profit would be reduced to $24,000, over 75% loss. This does not include other fees such as stamp duty which you paid when purchasing the house and the amount which must be returned to CPF. It would likely be a cashless sale.
At this point, would it be better to take the money out and lock in your profits while reinvesting it into another property which has better growth potential such as new launches?
If you are interested in a more detailed breakdown or profit loss analysis for your unit and how to maximize your property investment returns, drop me a WhatsApp for more information.

